Open YouTube Studio, go to Analytics, then Audience, and check two things first: your monthly audience number and the new, casual, and regular viewer split. If new viewers are growing but regulars are flat, your channel has a discovery problem, not a loyalty problem, and that single distinction tells you exactly what to fix next.
TL;DR:
- Growing new viewers while regular viewers remain flat indicates a discovery problem rather than a loyalty issue, requiring focus on outreach strategies.
- Comparing monthly audience to unique viewers reveals the reach of existing content versus new audience acquisition, guiding content experimentation.
- Tracking return viewers, watch time, and engagement metrics weekly and monthly helps identify trends before they become sustained problems.
- Audience demographics and watching patterns should inform format, content, and platform optimization, especially when viewer data shows unexpected regional or age group segments.
- Using Advanced Mode, exports, and third-party tools enables deeper analysis of performance data, but small number fluctuations over short periods are often noise rather than signals.
What the Audience tab contains: monthly audience, unique viewers, and special reports
The Audience tab is where YouTube tells you who is actually watching, not just who subscribed three years ago and forgot. Two numbers anchor the whole report: monthly audience and unique viewers. Monthly audience counts the people who watched your channel in the last 28 days, including repeat visits from the same person. Unique viewers strips out the repeats and tells you how many distinct people actually showed up. According to YouTube’s own guidance, creators should lean on unique viewers and monthly audience to estimate active reach, because subscriber count alone doesn’t tell you who’s still paying attention.
That gap between subscribers and unique viewers is bigger than most creators expect. I’ve watched channels with six-figure subscriber counts pull in a fraction of that in monthly unique viewers, which is a wake-up call the first time you see it. Subscribing is a one-time click. Watching is a repeated decision, and it’s the only one that actually matters for growth.
Beyond those two headline numbers, two reports do most of the heavy lifting for content decisions:
- What your audience watches shows the other channels and videos your viewers engage with, which is gold for finding collaboration partners, competitive content gaps, and thumbnail or title patterns worth testing.
- When your viewers are on YouTube maps out the hours and days your audience is actually active, so you can time uploads and Premieres to land when people are scrolling instead of asleep.
YouTube’s help documentation recommends using the “when your viewers are on YouTube” report specifically to optimize your publishing schedule, and the “what your audience watches” report to identify content themes and collaboration opportunities. Both are buried a click deeper than the headline stats, and both are worth checking before you plan your next month of uploads.
Here’s the part that trips people up: subscribers and active viewers are not the same audience. You can have a large subscriber base that barely shows up and a smaller base of unique viewers who watch everything you post. The same YouTube guidance notes that comparing unique viewers against subscriber counts helps you spot which videos pulled in outside reach versus which ones just served your existing base. A video that spikes unique viewers without a matching subscriber bump usually means you tapped into a new audience segment, which is exactly the kind of signal worth chasing with a follow-up video on the same topic.
Professional creators treat monthly audience and unique viewers as the primary health check, ahead of subscriber count, because those two numbers move in real time with what’s actually working. Subscriber count can stay flat for months while your active audience quietly grows or shrinks underneath it. If you’re only checking subscribers, you’re reading last year’s newspaper.
Metrics and signals to track every week and month
Once you know where the reports live, the next question is which numbers deserve your attention on a recurring basis. Not every metric needs daily monitoring, but a short weekly check and a deeper monthly review will catch problems before they become trends.
- Monthly audience: a steady climb means your channel is reaching more people over time; a flat or declining trend means your upload cadence or discovery strategy needs a look.
- Unique viewers: compare this against subscriber count monthly; a growing gap in the wrong direction (unique viewers shrinking while subscribers stay flat) signals your existing audience is losing interest.
- Returning viewers: this is your loyalty signal. A rising share of returning viewers means your content is building habits, not just one-off clicks.
- Watch time: total watch time trending up with flat upload volume means your content is getting more efficient at holding attention per video.
- Average view duration: a sudden drop on a specific video usually points to a pacing issue or a misleading title or thumbnail that’s pulling in the wrong crowd.
- Retention curve: look for cliffs in the first 30 seconds, which almost always mean the intro is too slow or the thumbnail promised something the video doesn’t deliver.
- Subscribers vs non-subscribers watch time: a channel leaning too heavily on subscriber watch time has a discovery ceiling, since algorithmic reach depends on reaching people who haven’t subscribed yet.
- Traffic sources by segment: check whether new viewers arrive through search, suggested videos, or browse features, since each source rewards a different optimization (search favors titles and descriptions, suggested favors thumbnails and topic relevance).
Subscribers watch roughly twice as much as non-subscribers on average, according to platform data from Sprout Social, which is a useful reminder that subscriber count still matters for watch time even though it’s a poor proxy for total reach.
That statistic cuts both ways. Subscribers are valuable because they watch more per person, but they’re also a ceiling. If your channel’s growth depends entirely on an audience that already knows you, you’ve built a comfortable plateau, not a growth engine. The fix is almost always the same: find where your non-subscriber watch time is thin, and test content formats or topics that are more likely to get pushed to people who’ve never heard of your channel. Our guide to the 12 metrics that matter most breaks down how to weight these signals against each other when they start pulling in different directions.
One quick corrective worth trying immediately: if retention craters in the first 30 seconds across several videos, cut your intro length in half before you touch anything else. It’s the single fastest fix most channels never try because it feels too simple to matter.
Step-by-step analysis workflow creators can run (weekly and monthly)
Numbers without a process are just numbers. Here’s the routine I’d run if I were starting from scratch on a channel today, and it doesn’t take more than 30 minutes a week once you build the habit.
- Snapshot your audience composition. Once a week, record monthly audience, unique viewers, and the new/casual/regular split in a simple spreadsheet. You’re building a baseline, not reacting to a single day’s numbers.
- Isolate high-potential segments or videos. Monthly, pull your top five videos by unique viewers and compare them against your five weakest performers. Look for shared traits: topic, length, thumbnail style, or upload day.
- Design a focused experiment. Pick one variable, title phrasing, thumbnail style, video length, or upload cadence, and change only that one thing across your next three to five uploads. Changing two variables at once means you’ll never know which one moved the needle.
- Measure using 28-day cohort comparisons. Use the monthly audience window to compare the 28 days before your experiment against the 28 days after. This smooths out day-to-day noise and gives you a fair read on whether the change actually worked.
For creators who want to go deeper than the standard dashboard, Advanced Mode lets you group videos by custom tags, compare two time periods side by side, and break down performance by traffic source or geography simultaneously. YouTube’s documentation on Advanced Mode covers the breakdown and export options in detail, and it’s worth the ten minutes it takes to learn, especially if you’re running channel-wide experiments rather than single-video tests.
When you look at cohort shifts, resist the urge to declare victory after one good week. A single viral video can distort your numbers for the following 28-day window, so check whether the lift is spread across multiple videos or concentrated in one outlier before you change your whole strategy based on it.
Pro Tip: Change one variable at a time, and judge success by returning viewers and follow-on views, not just total views. A video that pulls big numbers but doesn’t convert any new viewers into regulars hasn’t actually grown your channel; it’s just borrowed attention for a day.
This workflow sounds slow compared to chasing whatever trend is hot this week, but it’s the difference between a channel that grows on purpose and one that grows by accident. Accidental growth doesn’t compound. Deliberate growth does.
Segmenting viewers and tactics to grow regular viewers
YouTube splits your audience into three buckets: new viewers (first-time watchers), casual viewers (people who’ve watched before but inconsistently), and regular viewers. YouTube defines regular viewers as people who return at least once a month for more than six months out of the past year. That’s a high bar, and it’s deliberately set that way because regular viewers are the segment that matters most to the platform’s recommendation system.

The same YouTube guidance notes that the recommendation system favors channels with stronger regular-viewer retention, which means growing this segment doesn’t just build loyalty, it directly improves how often YouTube suggests your videos to new people. This is the mechanism behind why some channels seem to get “boosted” after a period of consistency: they’re not getting lucky, they’re converting casual viewers into regulars and the algorithm is responding to that pattern.
A few tactics reliably move viewers from casual to regular:
- Build playlists and series so viewers have an obvious next video to watch instead of leaving after one, which also gives YouTube a clearer signal about topic continuity.
- Publish on a predictable schedule so your audience knows when to expect new content, which is the single biggest lever for turning casual viewers into habitual ones.
- Use community features like Premieres, community posts, and live streams to create recurring touchpoints between uploads, keeping your channel in front of viewers even on days you don’t publish.
- Design end screens as funnels, pointing viewers toward a related video or playlist rather than a generic “subscribe” card that does nothing for session behavior.
To measure whether these tactics are working, track returning viewers month over month, watch for follow-on views (viewers who click into a second video from the first), and check watch time per viewer rather than just total watch time. A rising watch-time-per-viewer number means your existing audience is spending more time with you, even if your total viewer count hasn’t moved yet. Our retention strategies post walks through specific playlist and end-screen structures that tend to perform well for this kind of conversion.
Using demographics and audience-watching data to refine format choices
The age, gender, geography, and subtitled-language charts in your Audience tab exist to answer one question: does the audience you’re actually reaching match the audience you’re making content for? YouTube suggests comparing your mental model of your typical viewer against what the Analytics charts actually show, and adjusting your creative direction based on the gap.
That gap is often bigger than creators expect. You might be scripting for one age group while your actual audience skews ten years older or younger, or assuming a single-country audience when subtitled-language data shows meaningful viewership from a region you never considered targeting. These aren’t reasons to panic-pivot your whole channel, but they are reasons to test a video or series aimed specifically at the segment showing unexpected strength.
Practical ways to use this data:
- Check geography and subtitled-language breakdowns to see if you have an underserved international audience worth targeting with subtitles or region-specific references.
- Use the “what your audience watches” report to find channels your viewers already watch, which doubles as a collaboration shortlist and a source of thumbnail and title inspiration worth adapting.
- Match format to consumption pattern: if your audience skews heavily toward mobile and short sessions, testing Shorts as a discovery funnel makes more sense than doubling down on 25-minute long-form videos.
- Treat live content as a loyalty test: audiences that already show strong regular-viewer behavior tend to respond better to live streams, since live format rewards viewers who already check in consistently.
None of this means chasing every demographic shift. It means using the data to decide which formats deserve a real test instead of guessing based on what’s trending for other creators in a completely different niche.
Data access and practical tooling: Advanced Mode, exports, and basic analysis
The Studio dashboard is enough for most weekly checks, but once you want to slice data by multiple dimensions at once, you’ll need Advanced Mode. It unlocks custom video groupings, side-by-side period comparisons, and breakdowns by traffic source, geography, or device type layered together instead of one at a time.
Exports have limits worth knowing before you build a workflow around them. Standard CSV exports from Studio cap out at a few hundred rows, and once your analysis needs exceed that, YouTube’s documentation points creators toward the Reporting API, which is built specifically for datasets beyond 500 rows. If you’re running a single channel and checking monthly trends, you’ll rarely hit that ceiling. If you’re managing multiple channels or want historical data going back years for a deeper pivot analysis, the API is the right tool.
For creators comfortable with spreadsheets, a basic workflow looks like this:
- Export your top 50 videos monthly with views, watch time, and average view duration, then sort by unique viewers to spot patterns across your best performers.
- Build a simple pivot table comparing traffic source against retention to see which discovery channels bring viewers who actually stick around versus ones who bounce immediately.
- Track month-over-month deltas in a running spreadsheet rather than relying on memory, since small trends are easy to miss without a written baseline.
A growing category of third-party dashboards and trend trackers exists to automate this kind of pivoting, pulling data across multiple videos or channels into a single view without manual exports. These tools are worth exploring once your channel outgrows what a monthly spreadsheet check can handle, though the fundamentals, unique viewers, returning viewers, and watch time by segment, stay the same no matter which tool displays them.
Who’s behind this guide and what it’s built on
This guide was written by Arnas, drawing on Voclify’s work helping faceless creators operationalize the exact reports covered above. Voclify is an AI-driven toolkit built specifically for faceless YouTube creators, with tools for generating scripts, titles, thumbnails, and voiceovers designed to move fast once an audience insight points toward a clear next step. The platform has been used by over 1,000 creators, with channels built on it collectively gaining millions of subscribers.
The gap between knowing your audience and acting on that knowledge is usually where channels stall. A creator might spot that their regular-viewer percentage is low and know, in theory, that a tighter publishing schedule and better playlist structure would help. Actually producing three scripts, testing two thumbnail styles, and rewriting a handful of titles to test a hypothesis takes hours most solo creators don’t have on a weekly basis.
That’s the practical case for pairing audience analysis with tools built to shorten the gap between insight and execution. A creator who notices their “what your audience watches” report pointing toward a specific adjacent topic can move from observation to a published test video in a fraction of the time it would take to script, voice, and design a thumbnail manually. Speed of iteration, not just quality of insight, is often what separates channels that act on their data from channels that just collect it.
Understanding the impact of algorithm changes on your audience reports
YouTube’s recommendation system shifts periodically, and those shifts can make your audience data look like it’s telling a different story than it actually is. A sudden dip in unique viewers might reflect a genuine content problem, or it might reflect a temporary change in how the algorithm is distributing suggested videos across your niche.
The practical response is patience paired with pattern-watching. Don’t overreact to a single week of unusual numbers, especially right after you notice a broader shift in how your suggested-traffic numbers behave. Instead, watch whether the change persists across a full 28-day monthly audience window and whether it’s isolated to your channel or appears to be affecting your “what your audience watches” comparison set as well.
YouTube’s guidance is consistent on one point regardless of algorithm shifts: regular viewers and unique reach remain the most reliable signals of channel health, because they reflect actual viewer behavior rather than a temporary distribution pattern. When in doubt, re-anchor to those two numbers rather than chasing whatever the algorithm seems to be rewarding this particular month. Algorithms change. Viewers who keep coming back are a signal that holds up regardless of what’s happening on the distribution side.
Benchmarking your audience data against other channels in your niche
You can’t see a competitor’s internal Analytics dashboard, but you can benchmark against public signals: view counts per video, upload frequency, comment engagement, and how their content shows up in your own “what your audience watches” report. If a channel in your niche appears repeatedly in that report, your shared audience is already voting with their attention, and that’s worth paying attention to.
A useful benchmarking exercise is comparing your video length, upload cadence, and thumbnail style against two or three channels that show up consistently in your audience’s viewing habits. You’re not trying to copy them. You’re trying to understand what your shared audience already responds to, so your own experiments start from an informed baseline instead of a blind guess.
Public view counts and engagement ratios also give you a rough sense of scale. If a channel with a similar subscriber count is pulling noticeably higher views per video, it’s worth studying their titles and thumbnails for patterns you haven’t tested yet. Third-party watch time guidance offers additional benchmarking approaches if you want a broader view of how watch time strategy varies across channel sizes and niches.
Using audience interests and affinity signals to sharpen your content
Beyond basic demographics, YouTube and Google’s broader advertising tools expose interest and affinity data that can sharpen your sense of what else your audience cares about. Google’s Insights Finder combines Search and YouTube signals to build topic-level audience profiles, which is primarily built for advertisers but useful for creators scouting adjacent content ideas.
The practical use case is topic expansion. If your core content covers one narrow subject, affinity data can reveal related interests your audience already holds, interests you haven’t made a single video about yet. That’s a lower-risk way to expand your content calendar than guessing based on what’s trending for creators in an unrelated niche.
Treat affinity categories as a hypothesis generator, not a mandate. A shared interest doesn’t guarantee your specific take on that topic will land. Test it the same way you’d test any other format change: one video, one clear hypothesis, measured against your existing baseline for retention and unique viewers before you commit a whole series to the idea.
Reading device and platform data to choose the right format and length
Your Audience tab also breaks down viewing by device, mobile, desktop, TV, and tablet, and that breakdown has direct implications for format decisions. A channel watched predominantly on TV screens can support longer, slower-paced videos, since viewers are often settled in for a longer session. A channel watched mostly on mobile during short, scattered sessions benefits from tighter pacing and may have more room to grow through Shorts as a discovery funnel.
TV viewing in particular has grown as a share of YouTube consumption across the platform, which is part of why long-form content hasn’t been displaced by the rise of short-form. The two formats serve different moments in a viewer’s day, and your device breakdown tells you which moment your channel currently owns.
If your device data is roughly even across mobile and TV, that’s often a signal you have room to test both long-form and Shorts without cannibalizing either, since you’re reaching viewers in genuinely different viewing contexts rather than competing for the same attention span. Watch how retention curves differ by device, too. A video that holds attention well on TV but drops fast on mobile may need a tighter edit for its mobile cut, or may simply be better suited to viewers who’ve already committed to a longer session.
When to prioritize data vs creative identity
Here’s where I’ll push back on the all-data-all-the-time crowd: not every metric dip deserves a reaction. A single video underperforming doesn’t mean your format is broken, and a short-term demographic shift often resolves itself within a month without any intervention on your part.
The mistake I see most often isn’t ignoring data, it’s overcorrecting on too little of it. A creator sees one week of soft numbers and rewrites their entire content strategy around a sample size that wouldn’t hold up to basic scrutiny. Data should inform small, disciplined experiments, not trigger a full identity crisis every time a number wobbles.
My rule of thumb: if a trend holds across a full 28-day monthly audience window and shows up in more than one video, it’s signal. If it’s confined to a single upload or a single week, it’s probably noise. Run the small test before you run the big pivot, and never let a dashboard talk you out of the creative instinct that got your channel here in the first place. Metrics tell you what happened. They rarely tell you why, and the why is usually where your judgment still matters most.
— Arnas
How Voclify helps you put these insights into action
Once you’ve spotted the gap, maybe it’s a weak returning-viewer rate, a format mismatch, or an underused topic from your affinity data, the next step is producing content fast enough to actually test it. That’s the part Voclify is built for. The toolkit generates titles, scripts, and thumbnails tailored for faceless channels, so a hypothesis from your Audience tab can turn into a published test video without the usual production bottleneck.
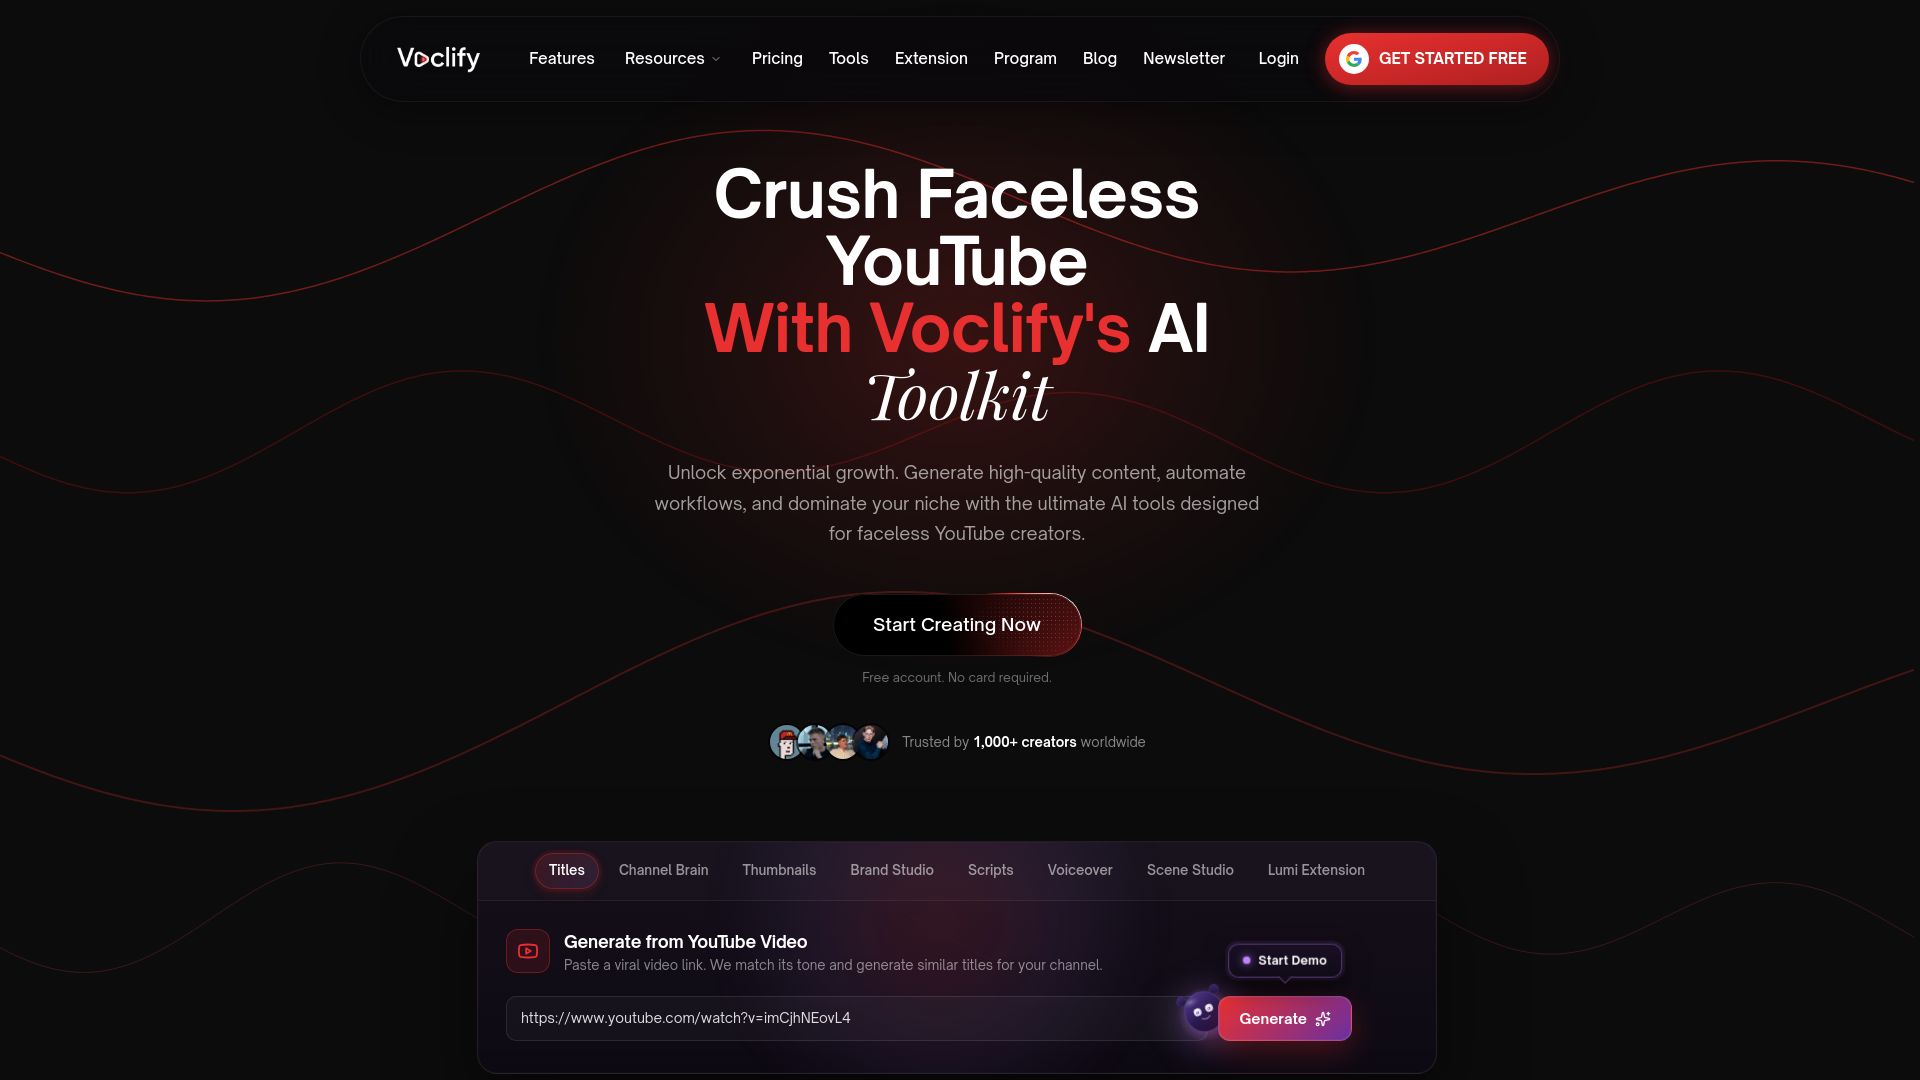
If you’ve identified that your audience responds better to a specific topic or format, Voclify’s title generator and thumbnail generator let you produce several variations quickly, so you can run the kind of one-variable-at-a-time test described earlier in this guide without spending a week on each version. The script generator and AI voiceover tool handle the production side for faceless formats specifically, which is where a lot of creators lose the most time between having an insight and acting on it.
Plans start with Starter at a low monthly price, Growth at a mid-tier price, and Studio at a higher monthly price, all listed on the Voclify homepage. Creators who want more hands-on structure around turning audience data into a repeatable content system can also look at the YouTube Faceless Operator Program for a guided approach. Either way, the goal is the same: shorten the distance between what your Audience tab tells you and what you actually publish next.
Sources
YouTube’s Audience tab tells you everything happening on the platform, but it doesn’t tell you what happens after someone clicks through to your website, product page, or email signup. Connecting YouTube data with Google Analytics closes that gap, letting you see whether traffic from specific videos converts into newsletter subscribers, product sales, or return website visits.
This matters most for creators whose channel supports a business beyond ad revenue: a course, a product line, or a service. Knowing which videos drive the most views is useful. Knowing which videos drive the most paying customers is a different, often more valuable, piece of information, and it only shows up when you combine YouTube’s audience data with a destination analytics tool.
A simple starting point is tagging your video descriptions with UTM parameters so Google Analytics can attribute website traffic back to specific videos or campaigns. Over time, this builds a second dataset that complements your Audience tab: one shows you who’s watching, the other shows you what they do next. Together, they give you a fuller picture than either source provides alone, and they let you weight your content calendar toward videos that move people, not just views that look good on a dashboard.
- Understand your YouTube audience - Computer - YouTube Help
- 25 YouTube Stats: Users, Marketing, Demographics 2024 Updated | Sprout Social
FAQ
How many views do you need to make $10,000 a month on YouTube?
YouTube revenue depends on your niche, audience location, and ad rates, so there’s no fixed view count that guarantees a specific income. Rather than targeting a view number, focus on growing unique viewers and watch time, since ad revenue scales with watch time and audience quality, not raw view count alone.
How can you see the demographics of your YouTube audience?
Open YouTube Studio, go to Analytics, then Audience, where you’ll find charts for age, gender, geography, and subtitled language alongside the monthly audience and unique viewer counts. YouTube’s documentation covers each of these reports and how to use them to inform content decisions.
How many views on YouTube do you need to make $2,000 a month?
This depends heavily on your audience’s location, niche, and ad rates, so there’s no single view count that applies universally. A more reliable approach is tracking watch time and unique viewers over time, since consistent growth in those numbers tends to track with revenue growth better than any fixed view target.
What are audience insights?
Audience insights are the data YouTube provides about who watches your channel and how they engage, including monthly audience, unique viewers, the new/casual/regular viewer split, and demographic and geographic breakdowns. These reports live in the Audience tab of YouTube Studio Analytics and are designed to guide decisions about content, format, and scheduling.
Recommended

Get more of this in your Google results
Add voclify.io as a preferred source and Google shows you more of our articles in Search and AI Mode.