That single pass, grounded in engagement rate and view velocity rather than subscriber count, typically surfaces three testable content ideas before Friday. Voclify’s automation can compress the pull-and-flag step from hours to minutes, but the framework matters more than the tool.
TL;DR:
- Analyzing engagement rate and view velocity over the past 90 days helps identify high-potential content ideas before they become obvious trends.
- Manually collecting and normalizing competitor data takes 10 to 15 hours per channel, but automation reduces that to minutes, making frequent analysis feasible.
- Focusing on viewer overlap rather than subscriber count reveals true competitors, especially by comparing channels within similar subscriber tiers and analyzing outlier performance.
- Metrics like engagement rate and view velocity predict impact better than subscriber count, with early momentum indicating long-term algorithmic success.
- Using automation tools for data collection and pattern detection allows creators to spend more time on nuanced analysis such as comment tone and hook effectiveness.
What Is YouTube Competitor Analysis and Why It Matters
YouTube competitor analysis is the practice of mapping what already works for channels chasing your audience, then using that map to make sharper content and business decisions. It’s not about cloning a rival’s video. It’s about spotting demand before you spend a week producing something nobody wanted. The goal, as outlined by Sprout Social’s competitor analysis framework, is to identify high-performing topics and audience sentiment so you build something unique and aligned with your own brand, not a knockoff of someone else’s hit.
Done properly, this research pays off in a few concrete ways:
- Content ideas — you spot topics your audience wants but nobody in your niche has covered well
- Monetization signals — you see which sponsors are paying for placement in your space and at what channel size
- Funnel fixes — you notice where competitors route viewers (email lists, communities, products) and where your own funnel is leaking
- Sponsor leads — recurring brand names in competitor descriptions often mean an open door for outreach
I’ve watched this play out with a single video. A mid-size cooking channel posted a “5-ingredient dinner” video that pulled multiple times its usual views. One creator noticed this, ran the same format across three different cuisines, and built an entire sub-series that now anchors that channel’s upload schedule. One outlier, spotted early, became a repeatable content pillar. That’s the entire point of this exercise: turning a data point into a system.
How Do You Run a Competitor Analysis Step by Step?
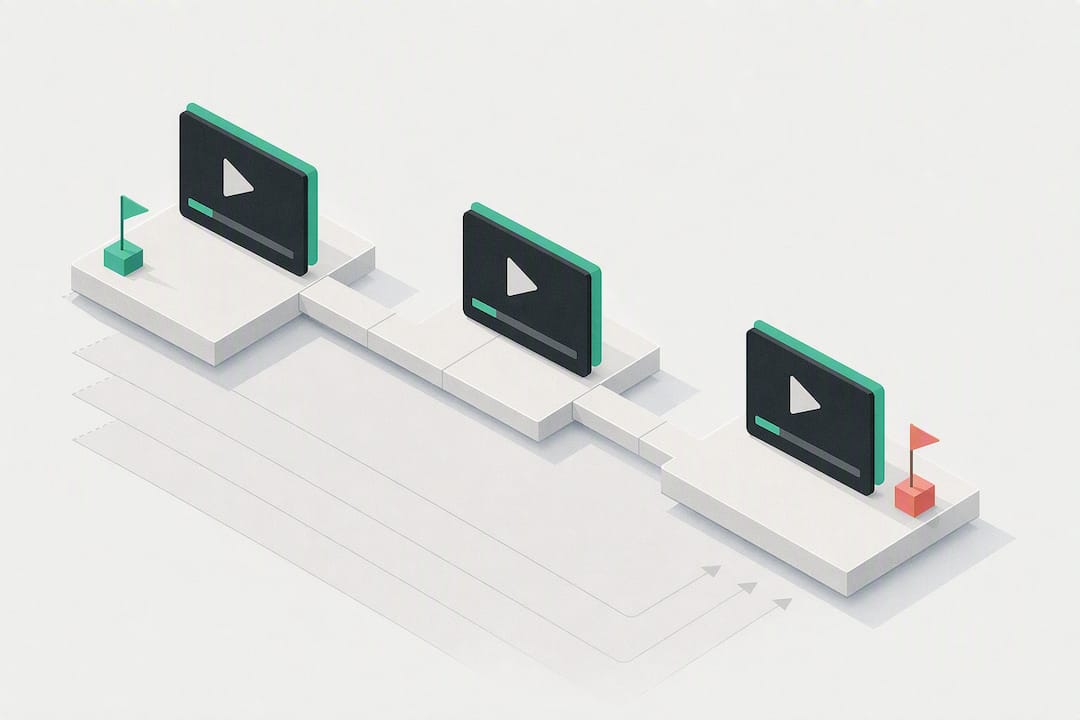
Treat this like a five-stage pipeline, not a one-time favor to yourself. Each stage has a clear deliverable, so you always know when to move to the next one.
- Discover — Build a list of 5 to 10 candidate competitors using seed channels, “recommended for you” rails, and shared guest appearances. Deliverable: a ranked shortlist.
- Collect — Pull the last 90 days of uploads per channel, including view counts, upload dates, titles, and thumbnails. Deliverable: a spreadsheet or dashboard export.
- Analyze — Calculate engagement rate, view velocity, and views-per-subscriber for every video, then flag outliers. Deliverable: a tagged dataset.
- Synthesize — Group findings by theme (format, hook style, topic cluster) and write a one-page summary per competitor. Deliverable: competitor briefs.
- Plan — Convert the top three insights into scripted, scheduled experiments. Deliverable: a content calendar with success metrics attached.
Running this manually takes roughly 10 to 15 hours per competitor, according to the workflow breakdown in OutlierKit’s competitor analysis guide, largely because collecting and normalizing view data by hand is slow. Automated tools compress that same discovery, collection, and outlier flagging into minutes, which is why most creators tracking more than two or three rivals eventually shift at least part of the process to software.
Sampling rules keep the whole exercise honest. Use a fixed time window (last 90 days, or 30 days for fast-moving news niches), pull at least 20 videos per channel, and group competitors by subscriber tier before comparing them. A 40,000-subscriber channel and a 2-million-subscriber channel simply don’t play by the same rules, and comparing their raw view counts will send you chasing the wrong lessons.
Pro Tip: Rerun the collect and analyze stages every 30 days for your top three competitors, but save the full discover stage for a quarterly refresh. Competitors rotate in and out of relevance faster than most creators expect.
How Do You Identify Your Real YouTube Competitors?
Subscriber count is the laziest way to define a competitor, and it’s usually wrong. Two channels can sit in the same niche label and share almost no audience overlap, while a channel in an “adjacent” category might be pulling from your exact viewer base every single week.
Start with seed-channel expansion: pick two or three channels you already know overlap with your audience, then use the platform’s “channels also watched” style signals and comment cross-pollination (same usernames commenting on both channels) to expand that list. Audience overlap, not shared keywords, is the real signal.
Once you have a list, rank by outlier ratio instead of raw subscriber count. The insight density is higher.
- Group competitors into subscriber tiers (under 50K, 50K to 250K, 250K to 1M, over 1M) before comparing metrics
- Weight small channels with high outlier ratios more heavily. They’re often testing formats before bigger channels catch on
- Discard channels with high subscriber counts but flat, predictable performance. There’s not much to learn there
Which Benchmarks and Metrics Actually Predict Impact?
Subscriber count tells you almost nothing about whether a video will perform. Engagement rate, view velocity, and views-per-subscriber tell you nearly everything.
Engagement rate (likes plus comments divided by views) exposes whether a video actually resonated or just got algorithmic distribution. A video with 500,000 views and near-zero comments is a different animal than one with 100,000 views and hundreds of comments per thousand viewers.
View velocity matters just as much as final view count. Measuring performance in the first 48 to 72 hours after publish, a method detailed in Metricool’s competitor analysis breakdown, tells you how fast a video caught traction, which is often a better predictor of long-term algorithmic push than the eventual total.
To keep comparisons fair across channels of different sizes:
- Calculate median views over a rolling 30-day and 90-day window, not a simple average, since one viral spike can distort an average beyond usefulness
- Normalize every metric against channel size before comparing across competitors
- Sample multiple videos per channel so a single lucky upload doesn’t skew your read
- Track views-per-subscriber over time to see whether a channel’s existing audience is actually watching, or whether growth is coming entirely from cold discovery
Statistic to remember: Metricool’s guidance recommends benchmarking against time-bounded medians across 30 and 90-day windows specifically because short spikes and seasonal effects otherwise distort your baseline. A channel’s “normal” performance only becomes clear once you strip out the outliers you’re trying to study separately.
How Do You Analyze Thumbnails, Titles, and Hooks?
Creative elements reward pattern spotting over gut instinct. Pull multiple recent thumbnails and titles from each competitor and lay them side by side. You’re looking for repeated formulas, not one clever example.

For thumbnails, note color palette consistency, whether faces appear and their expression style, and how much text sits on the image versus relying on the visual alone. Metricool’s sampling method recommends exactly this kind of 20-sample window because a single standout thumbnail tells you nothing about what a channel does reliably.
Titles follow the same logic. Track whether a competitor leans on numbers, questions, curiosity gaps, or direct promises, and how often each formula recurs across the sample.
Hooks need a different lens entirely: watch the first 15 seconds of each top-performing video and code what happens. Common patterns include a direct promise, a visual surprise, or a question posed straight to camera. Retention data in the first 15 seconds usually tells you more about a video’s staying power than anything in the thumbnail or title.
- Record whether each channel leans Shorts-heavy, long-form-heavy, or mixed, and note upload frequency for each format
- Shorts tend to function as awareness drivers, pulling in cold viewers, while long-form typically does the converting, a pattern Brand24’s competitor research also flags when tracking format roles
- Map which format each competitor uses for new-viewer acquisition versus audience retention
Pro Tip: When you spot a title formula repeating across multiple competitors, that’s a stronger signal than a formula appearing once, even if the one-off got more views. Consistency across channels beats a single lucky hit.
What Can You Learn From Mining Competitor Comments?
Comments are the most underused research asset on the platform. Metrics tell you what happened; comments tell you why, and what viewers wish had happened instead.
- Sample the right comments. Pull the top comments (sorted by upvotes, which surfaces what resonated most broadly) and the newest comments (which capture unfiltered, immediate reactions), a method Brand24 outlines in its comment-mining guidance.
- Code for linguistic patterns. Watch for repeated pain points (“I wish this covered X”), purchase intent phrases (“where do I buy this”), and the same question appearing across multiple videos, which signals unmet content demand.
- Catalog monetization signals. Log sponsor mentions, pinned-comment links, and CTAs found in descriptions, then track which brands recur across multiple competitors in your niche. That recurrence often means an open sponsorship lane for you.
This step alone tends to generate more usable content ideas than the metrics dashboard, because viewers are telling you exactly what’s missing in their own words.
How Do You Separate a True Outlier From a One-Off Fluke?
Not every high-performing video deserves imitation. Some are lightning strikes; others are the start of a repeatable pattern, and telling the two apart is where most competitor research goes wrong.
The baseline rule: flag any video hitting 3x or more of a channel’s recent median views within a bounded time window, a threshold OutlierKit’s definitive guide uses specifically because it filters out normal variance while still catching genuine breakouts. Below that threshold, you’re usually looking at noise.
Once a video clears that bar, run it through the Outlier Signal Method:
- View-to-subscriber ratio — did it pull views far beyond the channel’s existing subscriber base, suggesting cold-audience discovery?
- Velocity curve — did it spike fast and hold, or spike and immediately fade? A held spike suggests durable relevance
- Topic-timing alignment — did it ride a news cycle or trend that’s now expired, or does the topic stay relevant year-round?
The strongest confirmation comes from cross-channel patterns. If two or three unrelated competitors all saw a lift on the same topic within a similar window, that’s demand, not luck. A single spike on a single channel is a hypothesis. The same spike across multiple channels is close to a fact.
What Should You Automate vs. Do by Hand?
Some parts of this workflow reward speed. Others reward judgment, and no dashboard replaces a human reading between the lines of a comment thread.
Automate the repetitive, high-volume tasks: pulling view and engagement data across dozens of videos, flagging statistical outliers, transcribing videos for keyword and topic extraction, and setting alerts for sudden spikes on tracked channels. This is exactly the kind of work software handles faster and more consistently than a person scrolling through analytics tabs, a point echoed in OutlierKit’s case for tool-backed dashboards for speeding up repeated audits.
When evaluating any tool for this job, check for:
- Flexible date-range controls, not just a fixed “last 30 days” view
- Exportable CSVs so your data isn’t locked inside someone else’s dashboard
- Comment scraping depth, not just top-level metrics
- Transcript accuracy, since a garbled transcript wastes any downstream analysis
- Transparent pricing with no hidden usage caps
Keep hook experimentation and comment nuance analysis in human hands. A machine can tell you engagement rate dropped; it won’t tell you the tone of a comment section shifting from enthusiastic to skeptical. Reading real language for real frustration is still a judgment call.
How Do You Turn Findings Into a Content Plan That Ships?
Insight without a schedule is just a longer to-do list. Once your audit produces a stack of findings, run them through a simple impact-versus-ease matrix and commit to acting, not just noting.
- Score each idea on impact and ease. High impact, low effort ideas go first. High impact, high effort ideas get scheduled for later. Low impact ideas get cut regardless of how easy they’d be
- Pick three experiments, not ten. A tighter list, run for 60 to 90 days with clear metrics, consistently beats a sprawling checklist that never gets fully executed, a pattern noted in Sprout Social’s strategic framing of competitor research
- Define success per experiment before you publish. Attach a specific target: a view velocity threshold, a subscriber lift percentage, or a conversion action like email signups, so you’re not guessing at the end whether it “worked”
- Set your cadence. Run a 90-day test window, check in weekly on early signals, and schedule a full competitor re-audit every quarter as channels and formats shift
Pro Tip: Write your success metric down before you publish, not after. It’s easy to retroactively decide a video “did fine” once you see the number. A pre-set target keeps you honest about what actually worked.
What I’ve Learned From Running These Audits Repeatedly
Three things stand out after enough passes through this process. First, comment mining consistently outperforms pure metrics for generating usable ideas. Viewers tell you what’s missing if you actually read what they write. Second, subscriber count is close to worthless as a prioritization signal. A 20,000-subscriber channel with a high outlier ratio has taught me more than plenty of channels ten times its size. It stops you from chasing every video that merely did “pretty well.”

Automation earns its place here, but only as a scale option. It handles the data pulls and outlier flags faster than any human should try to. It still can’t read a comment section for tone or catch the joke that made a hook land.
— Arnas
How Voclify Fits Into This Workflow
Some tools don’t replace the judgment calls in this workflow but automate hours spent copying view counts into spreadsheets. Tools built for faceless creators managing content volume can handle the mechanical stages of competitor research so users spend their time on the analysis that actually needs a human brain.
Inside the toolkit, you’ll find automated support mapped directly to the stages covered above:
- Transcription tools that pull spoken content from competitor videos for topic and keyword extraction
- Theme and hook extraction that flags recurring patterns across a competitor’s upload history
- Title and thumbnail generation workflows, useful once your audit identifies a formula worth testing on your own channel
- Export-friendly outputs so your findings feed straight into a content calendar instead of sitting trapped in a dashboard
Manual comment reading and hook judgment calls still belong to you. That part hasn’t changed, and it probably shouldn’t. But if you’re tracking more than two or three competitors, the Voclify toolkit turns a 10-hour data pull into a 15-minute task, and the AI script generator picks up right where your competitor findings leave off. Start a free trial on Voclify’s homepage and run your first automated competitor scan this week.
Sources
- YouTube Competitor Analysis: The Definitive Guide (2026) | OutlierKit Resources
- YouTube competitor analysis: Turn insights into strategic growth
- How to Do a YouTube Competitor Analysis in 7 Steps
Recommended

Get more of this in your Google results
Add voclify.io as a preferred source and Google shows you more of our articles in Search and AI Mode.