
Browse features traffic is YouTube’s algorithm actively placing your video on browsing surfaces like the home feed, and it’s the clearest signal the recommendation system trusts your content enough to show it to people who never searched for it. When this number climbs, you’re not just getting views. You’re getting the algorithm’s endorsement, and that endorsement compounds into real subscriber growth over time.
TL;DR:
- Most Browse impressions occur on mobile, so creators should prioritize designing eye-catching thumbnails with minimal text and high contrast.
- Early performance signals such as impressions and click-through rate within the first few hours determine whether YouTube expands distribution over 24 to 48 hours.
- Optimizing for Browse requires packaging that creates curiosity quickly, as viewers are cold and scrolling through multiple options.
- Check your Browse share data regularly in YouTube Studio to compare click-through rate, retention, and timing against past uploads for better insights.
- Building consistent publishing schedules and testing single-variable packaging changes can significantly increase your video’s Browse traffic over time.
What Counts as Browse Features Traffic
Browse Features is the specific bucket in YouTube Analytics that counts views from viewers who found your video while scrolling, not typing a query. It’s a distinct traffic source from Search, and it groups together every surface where your thumbnail simply appeared in front of someone browsing, as Creator Essentials defines it.
Here’s what actually falls into that bucket:
- Home feed and homepage placements. The single biggest driver for most channels, since it’s where YouTube pushes content to viewers who haven’t subscribed yet.
- Subscriptions feed. Views from people already following your channel, though YouTube has shifted more of that traffic into the general Home feed over the past few years.
- Watch history and personalized mixes. Recommendations built from what someone watched last week, stitched into playlists the algorithm assembles automatically.
- Watch Later and trending contexts. Smaller slices, but they signal a viewer is actively curating what to watch next.
A Home feed placement usually means you’re reaching cold audiences. A Subscriptions placement means your existing base is showing up. Knowing which one moved is the whole game.
Browse vs. Suggested vs. Search vs. Shorts: What Actually Separates Them
Each source represents a different viewer mindset, and confusing them leads to the wrong optimization. Browse means someone was scrolling with no specific intent. Suggested means someone just finished a video and got a recommendation on the watch page. Search means someone typed a query. Shorts traffic runs through its own vertical feed with its own ranking logic entirely.
The viewer context changes everything about what you should optimize:
- Browse: the viewer sees only your thumbnail and title, cold, competing against a dozen others on the same screen. Packaging wins here.
- Suggested: the viewer just watched something related and is primed to keep going. Topical relevance to that prior video matters more than a flashy thumbnail.
- Search: the viewer typed words into a box. Titles and descriptions matching that exact phrasing matter more than raw visual punch.
- Shorts: the viewer is already in a swipe rhythm. The first second has to stop the thumb, not the eye.
A tutorial that ranks well in Search might completely underperform in Browse if the thumbnail doesn’t sell curiosity fast enough. That’s why creators optimizing purely for search intent often plateau. They’ve built content that answers questions well but never earns a second look on the home feed. Different traffic source, different job.
The Signals That Push a Video Into Browse Placements
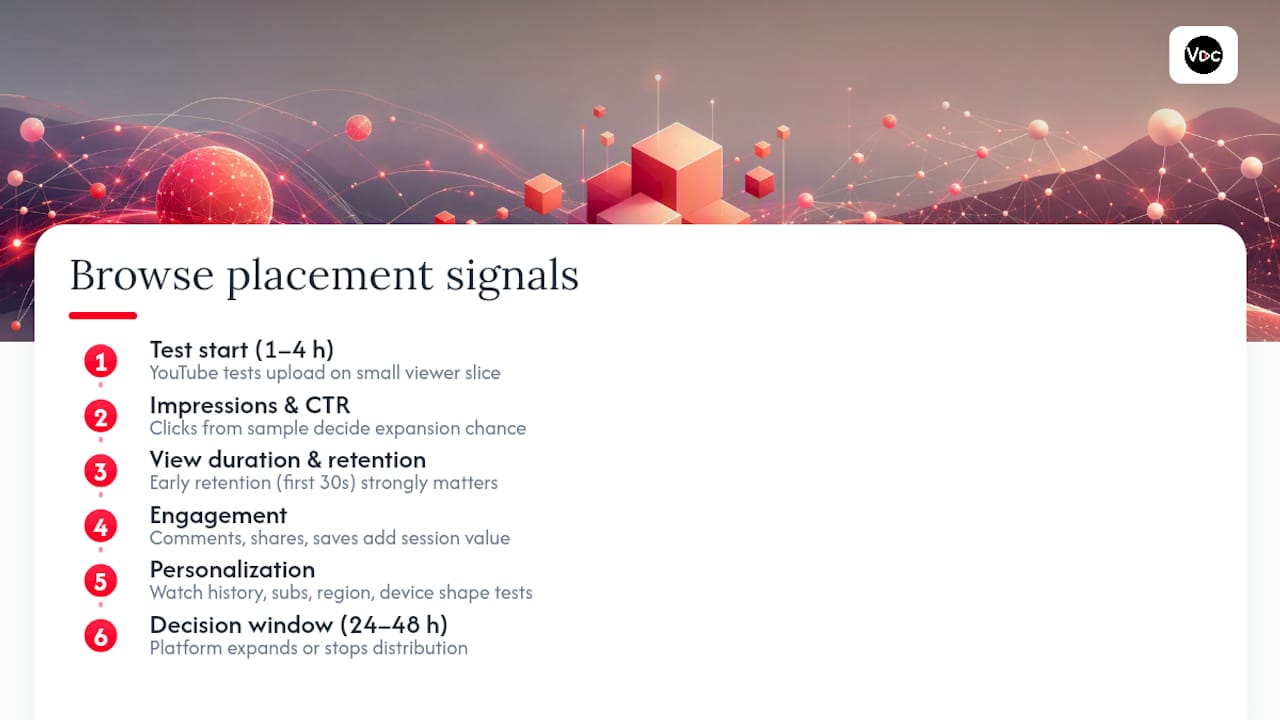
YouTube tests every new upload on a small slice of viewers before deciding whether to expand it further, and the signals it watches are measurable. Impressions and click-through rate come first. If your thumbnail doesn’t earn clicks from that initial sample, the algorithm has no reason to widen distribution, no matter how good the video itself turns out to be.
Average view duration and retention come next, and they’re arguably more important long term. A video that gets clicks but loses viewers in the first 30 seconds tells YouTube the packaging oversold the content, which is a faster way to kill momentum than a mediocre thumbnail ever could. Engagement, meaning comments, shares, and saves, adds a session-value layer on top. It tells the system this video kept someone on the platform, not just watching, but interacting.
Personalization runs underneath all of it. Watch history, subscription patterns, region, and device type all shape which specific viewers see your video during that test phase, according to Humble & Brag’s breakdown of Browse Features.
Here’s the number that matters most: YouTube typically begins testing an upload within the first 1 to 4 hours, then decides whether to expand placement over the following 24 to 48 hours based on how that early sample performs. Miss that window with weak packaging, and you’ve likely lost the algorithmic momentum for that upload permanently.
A Tactical Checklist to Increase Browse Features Traffic
You can influence every signal I just described, and most of the work happens before you even hit publish. Here’s the order I’d tackle it in.
- Fix your thumbnail for mobile first. Most Browse impressions happen on a phone screen roughly the size of a postage stamp. Use high contrast, three words or fewer of text, and a visual pattern-interrupt, meaning something that doesn’t look like every other thumbnail in that niche.
- Write titles that create a specific curiosity gap. Vague titles get ignored on a crowded home feed. Specific numbers, outcomes, or contradictions outperform generic descriptions almost every time.
- Architect your first 30 to 60 seconds like a hook, not a preamble. Skip the “hey guys, welcome back” opener. Start mid-action, ask a question the video answers, or show the payoff before explaining how you got there.
- Publish on a consistent schedule. Cadence matters less for the algorithm directly and more because it trains your existing subscribers to show up at predictable times, which seeds stronger early engagement.
- Seed early engagement deliberately. Pin a comment that asks a real question, prompt your community tab a few hours before publishing, and consider a short cross-post push to warm up that first-hour sample.
- Run controlled packaging tests. Change one variable at a time, thumbnail, intro trim, or title phrasing, across three separate uploads, then track CTR and retention for 48 hours before drawing conclusions, a workflow outlined in Miraflow’s traffic sources guide.
Pro Tip: Design your thumbnail’s visual promise and your first 10 to 30 seconds together, not separately. If the thumbnail suggests a specific payoff and the intro delivers it immediately, you cut the early exits that stop a video from ever expanding past its initial test group.
How to Check Your Browse Features Data in YouTube Studio
Open YouTube Studio, click into Analytics, then go to the Reach tab. From there, you’ll find a section labeled “How viewers find your videos,” and Browse Features sits as one row inside it, according to Creator Essentials’ navigation guide. Click “See more” and it expands into a full breakdown, including the Home versus Subscriptions split I mentioned earlier.
Pull four numbers every time you check this: impressions, click-through rate, views, and average view duration. Those four tell you almost everything about whether a video is packaging well, retaining well, or both.
Run this ten-minute diagnostic on your last three uploads:
- Compare CTR and retention across all three. A big gap usually points to one video’s thumbnail or intro doing something the others aren’t.
- Check your publish time against when your audience is actually online, visible in the Audience tab.
- Look specifically at each video’s first 48 hours. That window tells you whether the algorithm expanded distribution or stalled it early.
Keep a simple log, one line per upload, noting what you changed and what moved. Without that record, you’re guessing instead of testing.
Realistic Benchmarks: When Browse Traffic Shows Up and How Much to Expect
Browse share varies a lot by content type, and comparing your entertainment channel to a tutorial channel’s numbers will only confuse you. Entertainment and commentary content often lands in the 40 to 60% Browse range, as that content thrives on curiosity-driven thumbnails and cold discovery. These are illustrative ranges, not fixed targets, but they’re useful for knowing what “normal” looks like for your niche.
Timing follows the pattern already covered: an initial test in the first 1 to 4 hours, expansion over the following 24 to 48 hours if performance holds, and occasionally a slower secondary surge weeks later if a video keeps earning strong session value.
Stop tweaking and start applying what’s working to more uploads.
Real Evidence From Creators Improving Their Browse Share
I’ve watched channels change one thumbnail template and one intro structure, then see their Browse share climb over a handful of uploads, with CTR and average view duration both moving in the same direction at once. That combination, higher clicks and longer watch time together, is what tells YouTube to widen distribution rather than pull back.
For a deeper look at the specific metrics behind these decisions, Voclify’s breakdown of CTR versus average play value walks through why both numbers need to move together, not just one. The full traffic sources explainer covers how Browse fits alongside Search and Suggested in the bigger picture.
What I’d Prioritize First If I Were Managing a Channel Today
Packaging comes first, retention comes second, cadence comes third. That order isn’t arbitrary. A weak thumbnail kills a video before retention even gets a chance to matter, and inconsistent publishing undermines both by never giving the algorithm a stable pattern to learn from.
The most common mistake I see is clickbait without retention to back it up. A thumbnail that oversells and an intro that underdelivers will spike CTR for exactly one test cycle before the algorithm punishes the resulting drop-off. A close second is test fatigue, changing too many variables at once and then having no idea which one actually worked.
Use a tool for speed once you already understand the mechanics. Manual experimentation teaches you what your specific audience responds to, and a toolkit like Voclify’s traffic source diagnostics helps you move faster once you know what you’re testing for.
— Arnas
Turn This Checklist Into a Repeatable System
Everything in this article works, but doing it manually for every single upload, thumbnail concepts, title variations, intro scripts, is where most creators run out of hours before they run out of ideas. Voclify is built specifically for faceless creators who need to produce that packaging consistently without becoming a full-time editor and copywriter on top of everything else.
The toolkit generates titles, thumbnails, and scripts built around the same retention and curiosity principles covered above, and it automates the repetitive parts of publishing so you can focus on the testing itself rather than the production grind. Plans start with the Starter tier at $20 per month, scaling up to Growth at $50 and Studio at $99, all detailed on the Voclify plans page. If you’d rather have hands-on guidance implementing this system across an entire channel, the YouTube Faceless Operator Program walks through it directly. Start with a small packaging test on your next upload and see which numbers move first.
Sources
The benchmark figures and homepage-dominance claims in this piece draw from Alan Spicer’s guide to YouTube Browse Features, which is worth a closer read for anyone wanting deeper detail on timing windows. The core definition and Studio navigation steps come from Creator Essentials’ glossary entry, a solid reference if you’re still getting oriented in Analytics. The signal breakdown, CTR, retention, engagement, and personalization, is grounded in Humble & Brag’s explainer. For understanding channel-level traffic distribution over time, the Semrush traffic analytics overview is a useful companion tool, and creators diagnosing broader growth stalls may also find Save Your App’s growth diagnostics helpful for a wider view beyond YouTube alone.
- YouTube Browse Features: How to Get Your Videos on the YouTube Homepage - Alan Spicer
- YouTube Browse Features: Meaning & How to Grow It | Creator Essentials
- Browse Features on YouTube: What It Means & Why It Matters
FAQ
What does “browse features” mean on YouTube?
Browse Features is the YouTube Analytics category that tracks views from viewers who discovered your video while scrolling rather than searching, including the home feed, subscriptions feed, and personalized mixes, as Creator Essentials explains. It’s one of several traffic sources listed in Studio, alongside Search and Suggested.
How is browse features traffic different from YouTube search?
Browse traffic comes from viewers with no specific query in mind, just scrolling and reacting to a thumbnail. Search traffic comes from someone actively typing a phrase, which means titles and descriptions need to match likely search terms rather than just visually stand out.
How many views does a YouTube video need to make $2,000 a month?
Ad revenue depends heavily on niche, audience location, and video length, so there’s no fixed view count that guarantees a specific dollar figure. Channels typically need a consistent, growing view base across multiple monetized uploads rather than a single viral hit, and diversifying traffic sources, including a healthy Browse share, tends to produce more stable monthly revenue than relying on one source alone.
Can Voclify help increase browse features traffic?
Voclify’s tools generate thumbnails, titles, and scripts built around the packaging and retention principles that influence Browse placements, and its plans start at $20 per month through the Voclify site. It won’t replace testing your own audience’s response, but it speeds up how many packaging variations you can produce and try.
What percentage of views should come from browse features?
It varies widely by content type. Entertainment and commentary channels often see 30 to 60% of views from Browse once they gain traction, while tutorial-style channels typically run lower, often in the 20 to 35% range, since Search carries more weight for problem-solving content.
Recommended

Get more of this in your Google results
Add voclify.io as a preferred source and Google shows you more of our articles in Search and AI Mode.