
Impressions count how many times a platform put your content in front of someone. Views count how many people actually watched it, and every major platform sets its own bar for what qualifies. That gap between “shown” and “watched” is why raw numbers across YouTube, TikTok, and Instagram never line up cleanly, and why comparing them without normalizing first leads to bad decisions.
TL;DR:
- Impressions count how often content is served, but do not necessarily indicate viewer engagement, which is only confirmed once playback starts and meets platform-specific thresholds.
- View definitions vary widely across platforms, with TikTok counting almost every autoplay as a view and YouTube requiring around 30 seconds or engagement to register one.
- Comparing raw views across platforms is misleading; instead, normalize metrics into tiers like exposure, initiated watch, qualified watch, and conversion for accurate cross-channel analysis.
- A significant factor in converting impressions to views is testing thumbnails and hooks quickly, with AI tools available to streamline rapid iteration and optimize click-through rates.
- Campaign objectives should determine whether to prioritize impressions for brand awareness or views and retention metrics for education or conversion goals.
Table of Contents
- Impressions vs Views: The Core Definitions and Related Metrics
- YouTube Impressions vs Views, TikTok, Meta, LinkedIn, and X: Platform Counting Rules Compared
- When Should You Prioritize Impressions Over Views?
- How to Normalize and Report Impressions vs Views Across Platforms
- Turning Impressions Into Views: Thumbnail, Hook, and Packaging Tactics
- What Teams Should Actually Fix Before 2026 Reporting Season
- Speed Up Your Thumbnail and Title Testing With Voclify
- Sources
Impressions vs Views: The Core Definitions and Related Metrics
An impression is registered every time your content gets served on a screen, whether or not anyone looks at it. A view is registered only after a viewer clears a platform’s specific attention threshold, which can be a matter of seconds or a percentage of the video watched. Reach is a third, often-confused metric: it counts unique accounts exposed to your content, while impressions count total exposures, including repeats to the same person.
This distinction matters more than most reporting dashboards let on. Impressions typically exceed views by a wide margin, because a single person scrolling past your thumbnail three times generates three impressions but, at most, one view. Reach stays flat in that scenario while impressions climb, which is exactly why a channel with heavy repeat exposure can show inflated impression counts without any real audience growth.
Four metrics do the heavy lifting once you move past the raw counts:
- Impressions — total times content was displayed, repeats included.
- Reach — unique accounts or viewers exposed, no repeats counted.
- CTR (click-through rate) — the percentage of impressions that converted into a click or a view, a number YouTube tracks explicitly through its impressions click-through rate reporting.
- Average view duration — how long viewers stayed once they did press play, which tells you whether the content delivered on what the thumbnail promised.
CTR answers “did the packaging work?” Average view duration answers “did the content hold up?” You need both numbers, because a high CTR with a low watch duration usually means a title or thumbnail overpromised.
YouTube Impressions vs Views, TikTok, Meta, LinkedIn, and X: Platform Counting Rules Compared
The word “view” does not mean the same thing on any two platforms, and that single fact wrecks more cross-channel reports than any other measurement issue in social media. Platforms count views with different thresholds: some count a view the instant a video starts playing silently in a feed, others require several seconds of active attention.
YouTube separates the two metrics explicitly. A thumbnail impression is logged whenever your video is shown to a viewer, whether on the homepage, in search, or in the sidebar. A registered view generally requires the viewer to start playback, and YouTube separately tracks “engaged views,” a stricter measure tied to intentional watch behavior rather than a brief accidental tap. Shorts complicate this further: a Short can log a view almost immediately on watch-start, while a long-form video’s view counting has historically been associated with roughly the 30-second mark, making direct comparisons between your Shorts and long-form numbers misleading if you don’t separate them in reporting.
TikTok counts views the loosest of any major platform. A video autoplaying in a user’s feed registers as a view almost instantly, with minimal time required. That produces enormous view counts, but the number tells you very little about attention. A TikTok “view” is closer to a YouTube impression than a YouTube view in terms of what it actually verifies.
Meta’s video products, spanning Instagram Reels and Facebook, historically counted a view once playback passed roughly three seconds. Meta has also been shifting its API toward unified “views” reporting across formats, which means older impression-based benchmarks and newer views-based ones won’t sit on the same trendline if you compare year over year without noting the change.
LinkedIn and X/Twitter set similarly tight thresholds. LinkedIn counts a video view after about two seconds combined with at least 50% of the player visible on screen, while X applies a comparable rule of roughly two seconds with 50% visibility. Both platforms track impressions separately for feed distribution and display ads, so a post can rack up thousands of impressions with a fraction converting into anything resembling sustained attention.
Here’s how the thresholds stack up side by side:
| Platform | What counts as an impression | What counts as a view |
|---|---|---|
| YouTube | Thumbnail shown to viewer | Playback started; engaged view is a stricter, separate metric |
| TikTok | Content shown in feed | Autoplay begins; minimal time required |
| Meta (Instagram/Facebook) | Content shown in feed or story | Roughly 3 seconds of Reels/video playback |
| Content shown in feed | About 2 seconds with 50% visibility | |
| X/Twitter | Content shown in timeline | About 2 seconds with 50% visibility |
The practical fallout: the view rates for the exact same video can differ widely across platforms due to counting mechanics rather than real audience interest. Before you tell a client or a boss that “TikTok outperformed YouTube,” check whether you’re comparing thresholds or comparing attention.
When Should You Prioritize Impressions Over Views?
Match your primary metric to your campaign objective, not to whichever number looks bigger. A brand-awareness push cares about reach and impressions first, because the goal is exposure at scale. A campaign built around education, lead generation, or product explanation needs to prioritize views, average view duration, and downstream clicks, because the goal is comprehension, not just exposure.
Run this quick diagnostic against your last few posts when the numbers don’t add up:
- High impressions, low views. This usually points to a packaging problem: a weak thumbnail, an unclear title, or distribution reaching the wrong audience segment entirely. Fix the hook before touching the budget.
- Low impressions overall. This is a distribution problem, not an attention problem. The algorithm or ad platform isn’t serving your content widely enough, which calls for better tagging, timing, or a paid boost rather than a creative overhaul.
- Decent views, weak average view duration. The thumbnail and title are doing their job, but the opening seconds of the content aren’t delivering on the promise. Revisit your hook and pacing before you touch anything upstream.
Pro Tip: Before increasing ad spend to fix a low-view problem, check your CTR first. A CTR under roughly 2 to 4% on a thumbnail that’s had a fair sample of impressions is almost always a packaging issue, not a budget issue, and no amount of extra spend fixes a thumbnail nobody wants to click.
How to Normalize and Report Impressions vs Views Across Platforms
Comparing raw view counts across platforms is close to meaningless once you know how differently each one defines “view.” The fix is building your own normalization layer that sits on top of native metrics, so your reporting reflects actual attention tiers rather than each platform’s most generous counting rule.
A workable framework groups every native metric into four tiers:
- Exposure — raw impressions or reach, the opportunity layer.
- Initiated watch — any playback start, including TikTok-style autoplay views and YouTube impressions that converted to a click.
- Qualified watch — attention that clears a meaningful bar, such as a completed hook or a defined percentage of runtime. Industry guidance suggests treating anything under roughly 3 seconds as initiated watch and setting an internal threshold, like 15 seconds or 50% completion, for what counts as qualified.
- Conversion — a click, subscribe, purchase, or whatever downstream action the content was built to drive.
Mapping platforms into this structure lets you calculate a retention-adjusted view rate (qualified watches divided by exposures) and a cost-per-qualified-view for paid content, both of which survive a cross-platform comparison in a way raw view counts never do.
For source data, native tools remain the most reliable starting point: YouTube Studio’s analytics, Meta Insights, TikTok Analytics, and LinkedIn Analytics each break out impressions, views, CTR, and average view duration separately. A monthly reporting snapshot should pull each platform’s raw numbers first, then apply your normalization tiers before putting anything side by side. Track engagement benchmarks like like-to-view ratios alongside your tiered metrics to catch drift between attention and interaction over time.
Document your tier definitions once and reuse them every reporting cycle. Platforms change their own definitions without warning, so a written internal standard is the only thing that keeps last year’s numbers comparable to this year’s.
Turning Impressions Into Views: Thumbnail, Hook, and Packaging Tactics
Most impression-to-view gaps trace back to two decisions made in the first few seconds of production: the thumbnail and the opening hook. For faceless creators without a face or personality to anchor recognition, thumbnail distinctiveness carries more weight in converting impressions into views than almost any other single variable, since there’s no host to build instant trust with a passing viewer.
A few things consistently move CTR in testing:
- Consistent brand identifiers — a recognizable color palette, font, or framing style so returning viewers recognize your content before reading the title.
- High contrast and large text — thumbnails get scanned at phone-screen size, so text that’s readable at a thumbnail’s actual display dimensions outperforms detailed, cluttered designs.
- Signal alignment — the thumbnail, title, and first five seconds of the script need to promise the same thing, because a mismatch between what’s promised and what plays kills both CTR and average view duration.
Pro Tip: Run three thumbnail variants against the same video before committing to a single upload, and check CTR after a modest sample of impressions rather than waiting for a full week’s data. Faster iteration beats a single best guess almost every time.
AI-driven thumbnail and title generation speeds this cycle up considerably, letting you test packaging variations in minutes instead of hours, which is the real unlock for creators trying to improve short-form performance without burning a week per experiment.
What Teams Should Actually Fix Before 2026 Reporting Season
The biggest gap I see isn’t a lack of data. It’s teams treating impressions and views as interchangeable in the same dashboard column. Fix that first: write down each platform’s actual definitions, then run a quick audit across your last 10 posts per channel, checking impressions, CTR, and early retention side by side.
Once you can see the pattern, prioritize packaging tests before you touch ad spend. A thumbnail or hook fix is cheap and fast to test; a budget increase against weak creative just amplifies the same problem at a higher cost.
— Arnas
Speed Up Your Thumbnail and Title Testing With Voclify
Faster packaging tests are the single highest-leverage fix for the impression-to-view gap, and manually designing new thumbnails or rewriting titles for every experiment eats the time most creators don’t have. Voclify’s AI thumbnail generator, title generator, and script generator let you produce multiple packaging variants in minutes instead of hours, so testing three thumbnail concepts against the same upload stops being a project and becomes a routine step.
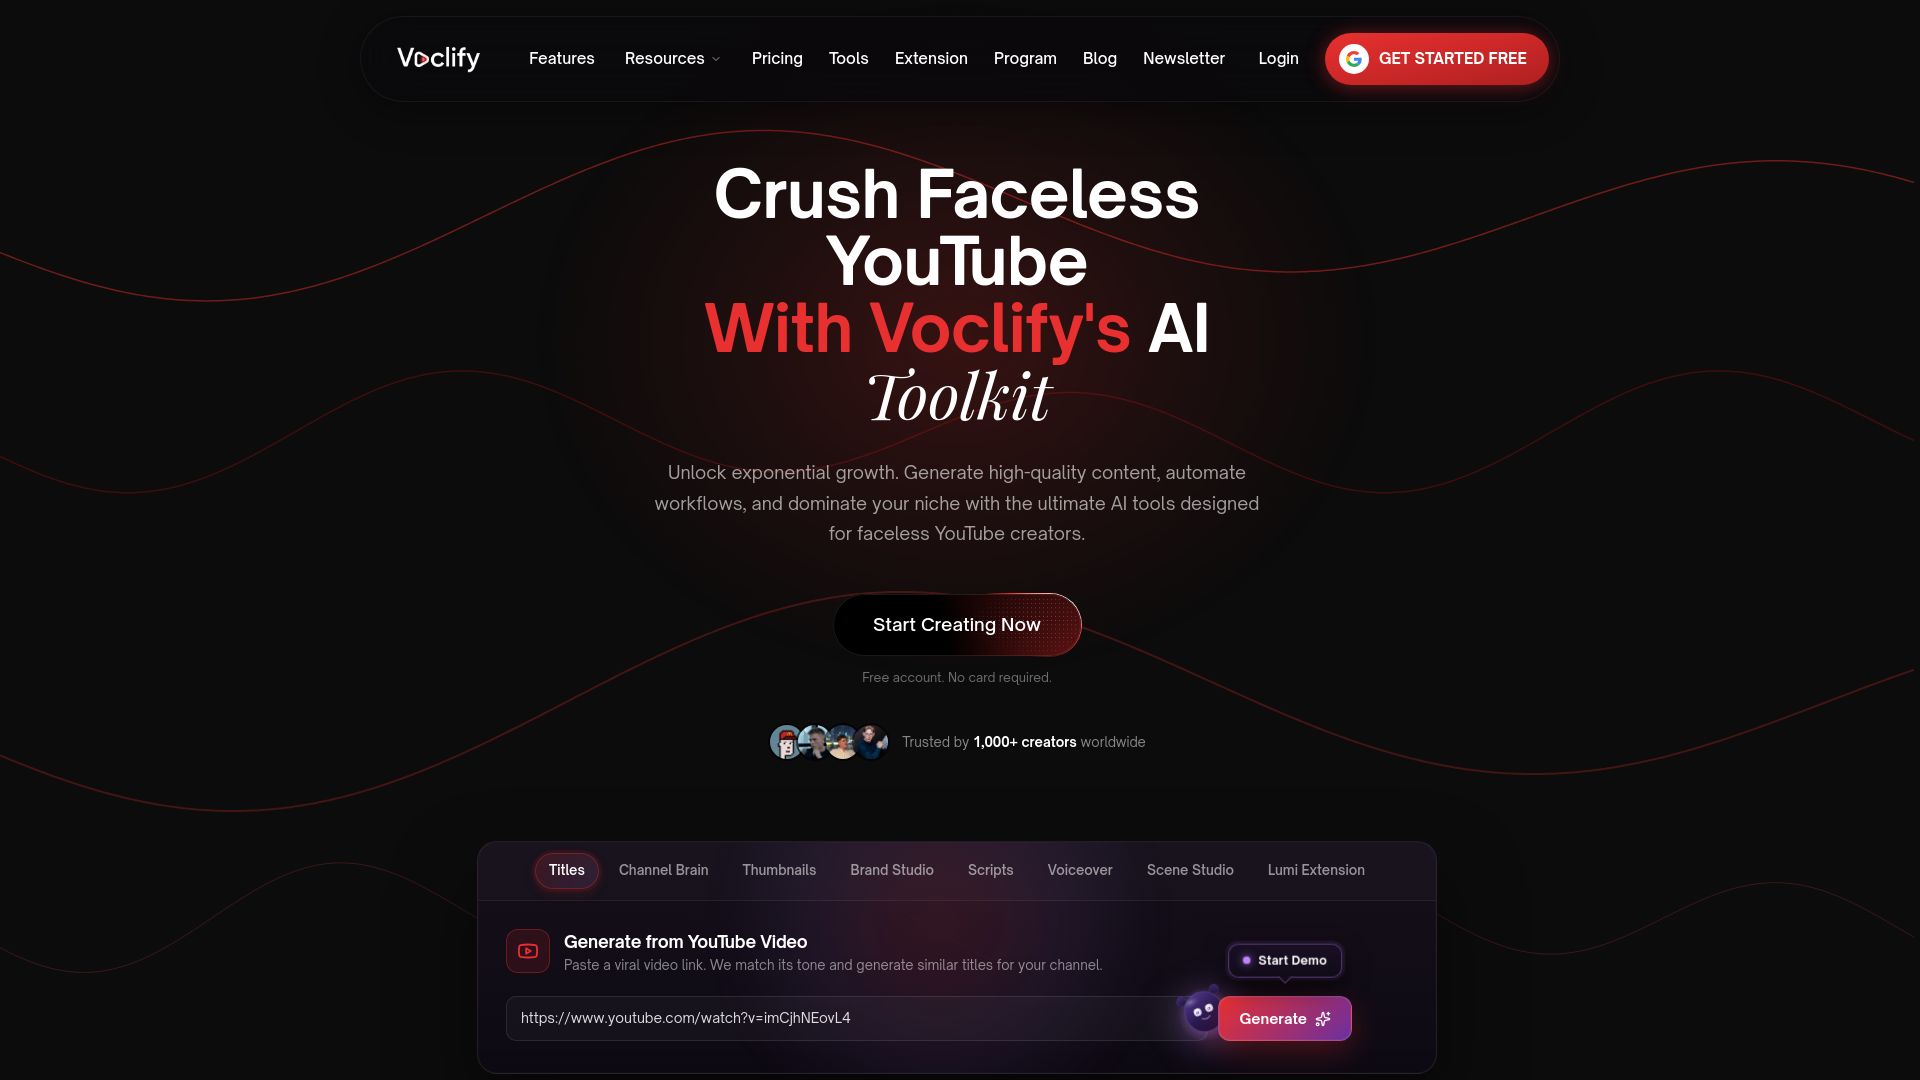
A practical workflow: generate three thumbnail variants for your next upload, run them against real impressions, and keep the one with the strongest CTR. Then use the script generator to test two different opening-five-seconds hooks against your winning thumbnail to see which one holds retention longer. Pair either tool with the AI voiceover generator if you’re producing faceless content without a recorded voice track. Start building your next test batch on the Voclify tools page and see how much faster packaging iteration moves once the guesswork is out of the design step.
Sources
- Impressions vs Views: What’s the Difference Between Them?
- Social Media Impressions vs. Views: What’s the Difference?
- Impressions click-through rate (YouTube Help)
Recommended

Get more of this in your Google results
Add voclify.io as a preferred source and Google shows you more of our articles in Search and AI Mode.